In this article, we will walk you through creating a Flutter application that displays sales data using hardcoded data. This simple yet effective tutorial will help you visualize sales data through various time intervals—daily, monthly, and yearly—using charts.
This Flutter application displays a sales data chart using hardcoded data.
Here's a summary of the code:
flutter create .
main function calls runApp to start the application with MyApp.MyApp is a StatefulWidget with its state defined in _MyAppState._MyAppState initializes the app and builds the MaterialApp with a centered SalesData widget.SalesData uses the flutter_hooks package for state management.getHardcodedOrders function.SfCartesianChart widget from the syncfusion_flutter_charts package.DailySalesData class holds the sales data for a specific date.getHardcodedOrders provides a list of hardcoded ReadyOrders.prepareDailyData, prepareMonthlyData, and prepareYearlyData convert the list of ReadyOrders into a list of DailySalesData for different time intervals.
ReadyOrders represents an order with a date and a list of OrderItems.OrderItem represents an item in an order with a price.The core of this tutorial is given in the code.
SfCartesianChart(
primaryXAxis: DateTimeAxis(
title: AxisTitle(
text: selectedChartType.value == "Daily"
? "---Daily"
: selectedChartType.value == "Monthly"
? "---Months"
: "---Years",
),
dateFormat: selectedChartType.value == "Daily"
? DateFormat('yyyy-MM-dd')
: selectedChartType.value == "Monthly"
? DateFormat('yyyy-MM')
: DateFormat('yyyy'),
majorGridLines: const MajorGridLines(width: 0),
edgeLabelPlacement: EdgeLabelPlacement.shift,
intervalType: selectedChartType.value == "Daily"
? DateTimeIntervalType.days
: selectedChartType.value == "Monthly"
? DateTimeIntervalType.months
: DateTimeIntervalType.years,
interval: 1,
),
title: ChartTitle(
text: selectedChartType.value == "Daily"
? 'Daily Sales Analysis'
: selectedChartType.value == "Monthly"
? 'Monthly Sales Analysis'
: 'Yearly Sales Analysis'),
legend: Legend(isVisible: true),
tooltipBehavior: TooltipBehavior(enable: true),
series: <CartesianSeries<DailySalesData, DateTime>>[
LineSeries<DailySalesData, DateTime>(
dataSource: data,
xValueMapper: (DailySalesData sales, _) => sales.date,
yValueMapper: (DailySalesData sales, _) => sales.sales,
name: 'Sales',
xAxisName: "Time",
yAxisName: "Amount",
dataLabelSettings: const DataLabelSettings(isVisible: true),
),
],
),
The description for the above code is here.
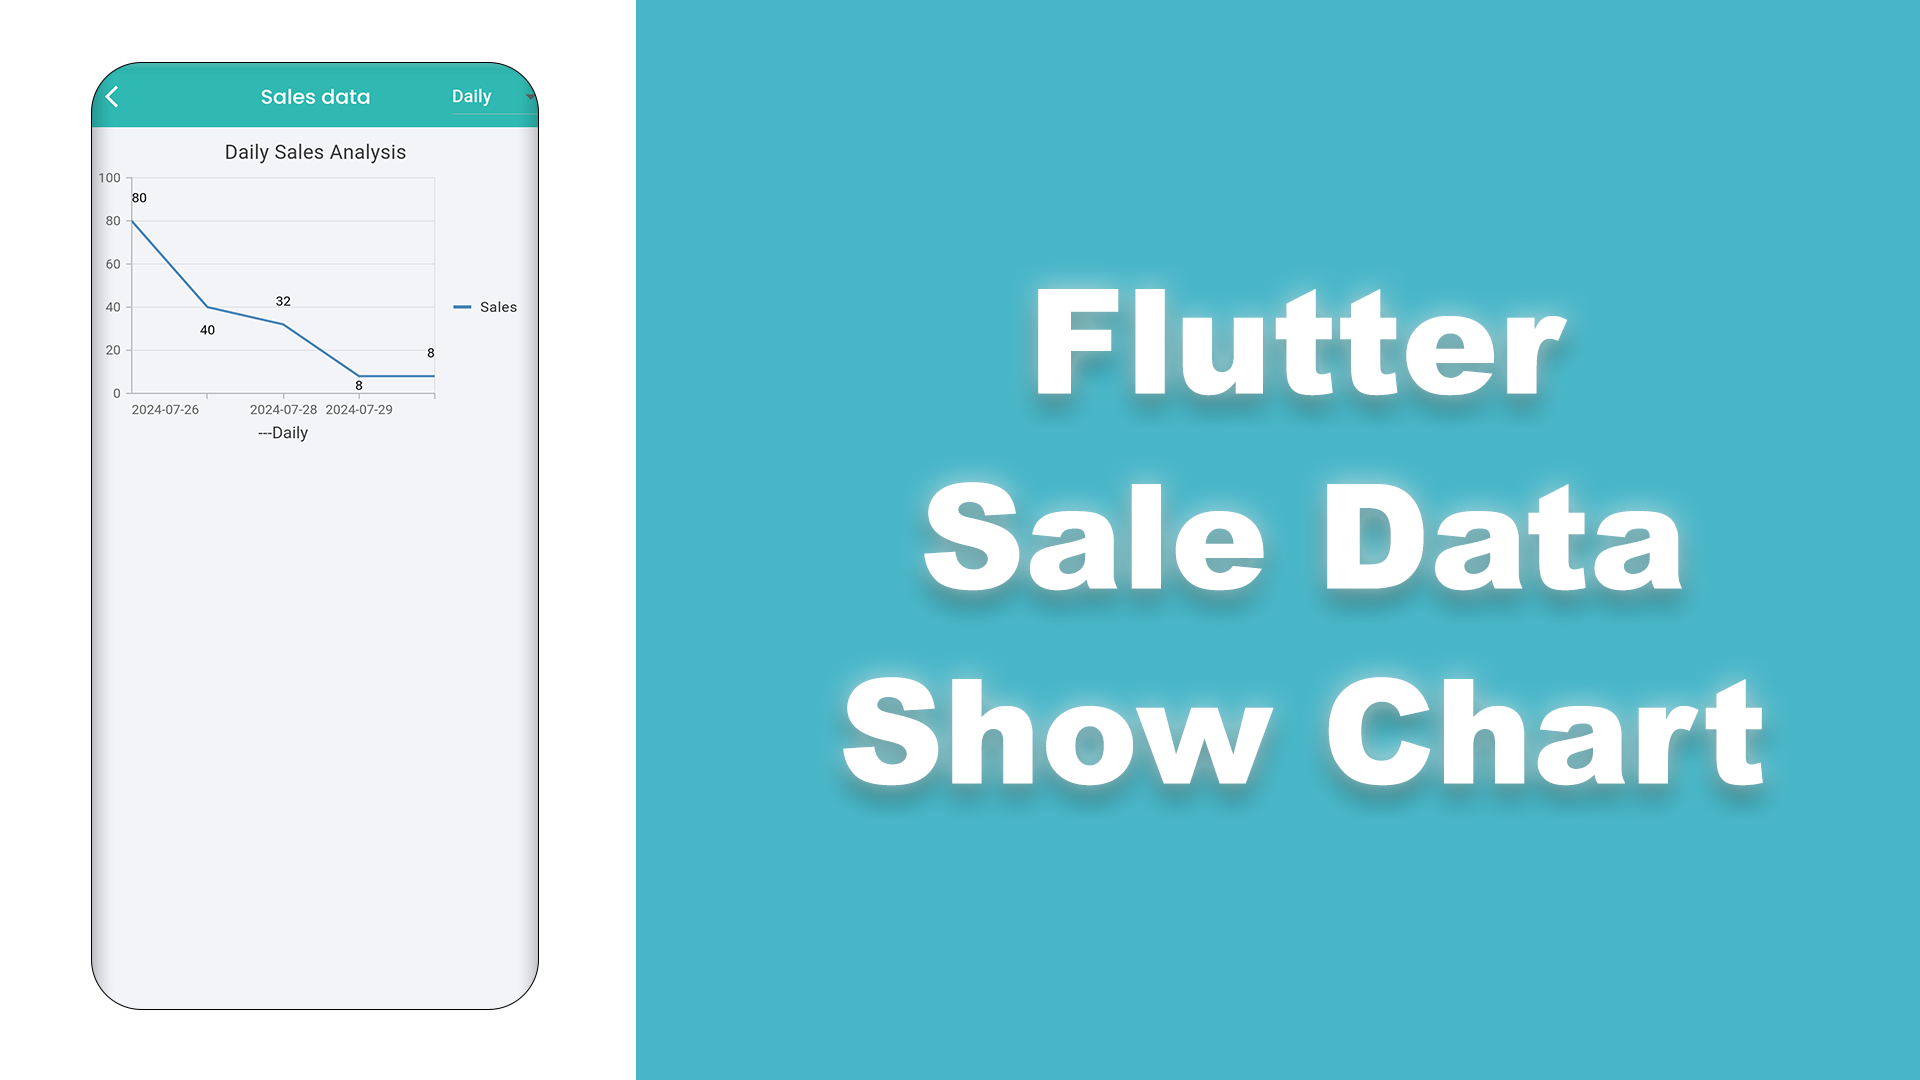
The SfCartesianChart widget in the Flutter application is used to display sales data in a visually appealing manner. It utilizes the DateTimeAxis as the primary X-axis, which allows for dynamic formatting based on the selected chart type—daily, monthly, or yearly.
The title of the X-axis changes accordingly to "---Daily", "---Months", or "---Years", and the date format adjusts to 'yyyy-MM-dd', 'yyyy-MM', or 'yyyy' respectively. The majorGridLines are set to a width of 0 to enhance visual clarity, and edgeLabelPlacement is set to shift, ensuring that labels do not overlap. The intervalType is also adjusted based on the selection, using days, months, or years as needed, with an interval set to 1 for consistency.
The chart itself has a dynamic title that changes based on the selected time interval: 'Daily Sales Analysis', 'Monthly Sales Analysis', or 'Yearly Sales Analysis'. It includes a visible legend and enables tooltips for better interactivity. The LineSeries is used to plot the sales data, with each DailySalesData object mapped to the X-axis (date) and Y-axis (sales). The data labels are made visible for each point to provide immediate insights.
This setup makes the SfCartesianChart a powerful tool for displaying and analyzing sales data over different time periods, enhancing the user's ability to understand trends and patterns.
void main() => runApp(const MyApp());
class MyApp extends StatefulWidget {
const MyApp({super.key});
@override
_MyAppState createState() => _MyAppState();
}
class _MyAppState extends State
{ @override
void initState() {
super.initState();
}
@override
Widget build(BuildContext context) {
return MaterialApp(
home: Scaffold(
body: Center(
child: SalesData(),
),
),
);
}
}
class SalesData extends HookWidget {
SalesData({Key? key}) : super(key: key);
@override
Widget build(BuildContext context) {
final orders = getHardcodedOrders();
final isLoading = false;
final selectedChartType = useState
("Daily"); if (orders.isEmpty) {
return Scaffold(
appBar: AppBar(title: Text("You don't have sales")),
body: const Center(child: CircularProgressIndicator(color: Color(0xffffa44f))),
);
}
List
data; if (selectedChartType.value == "Daily") {
data = prepareDailyData(orders);
} else if (selectedChartType.value == "Monthly") {
data = prepareMonthlyData(orders);
} else {
data = prepareYearlyData(orders);
}
return Scaffold(
appBar: AppBar(
backgroundColor: Color(0xFF30b9b2),
title: Text("Sales Data"),
actions: [
DropdownButton
( dropdownColor: Color(0xFF30b9b2),
value: selectedChartType.value,
items:
['Daily', 'Monthly', 'Yearly'] .map((String value) => DropdownMenuItem
( value: value,
child: Text(
value,
style: const TextStyle(color: Colors.white),
),
))
.toList(),
onChanged: (String? newValue) {
selectedChartType.value = newValue!;
},
),
],
),
body: Column(
children: [
SfCartesianChart(
primaryXAxis: DateTimeAxis(
title: AxisTitle(
text: selectedChartType.value == "Daily"
? "---Daily"
: selectedChartType.value == "Monthly"
? "---Months"
: "---Years",
),
dateFormat: selectedChartType.value == "Daily"
? DateFormat('yyyy-MM-dd')
: selectedChartType.value == "Monthly"
? DateFormat('yyyy-MM')
: DateFormat('yyyy'),
majorGridLines: const MajorGridLines(width: 0),
edgeLabelPlacement: EdgeLabelPlacement.shift,
intervalType: selectedChartType.value == "Daily"
? DateTimeIntervalType.days
: selectedChartType.value == "Monthly"
? DateTimeIntervalType.months
: DateTimeIntervalType.years,
interval: 1,
),
title: ChartTitle(
text: selectedChartType.value == "Daily"
? 'Daily Sales Analysis'
: selectedChartType.value == "Monthly"
? 'Monthly Sales Analysis'
: 'Yearly Sales Analysis'),
legend: Legend(isVisible: true),
tooltipBehavior: TooltipBehavior(enable: true),
series: <CartesianSeries<DailySalesData, DateTime>>[
LineSeries<DailySalesData, DateTime>(
dataSource: data,
xValueMapper: (DailySalesData sales, _) => sales.date,
yValueMapper: (DailySalesData sales, _) => sales.sales,
name: 'Sales',
xAxisName: "Time",
yAxisName: "Amount",
dataLabelSettings: const DataLabelSettings(isVisible: true),
),
],
),
],
),
);
}
}
class DailySalesData {
DailySalesData(this.date, this.sales);
final DateTime date;
final double sales;
}
List
getHardcodedOrders() { return [
ReadyOrders(
orderDate: DateTime(2023, 1, 1),
orderItems: [OrderItem(price: 50.0), OrderItem(price: 100.0)],
),
ReadyOrders(
orderDate: DateTime(2023, 1, 2),
orderItems: [OrderItem(price: 70.0)],
),
// Add more hardcoded orders as needed
];
}
List
prepareDailyData(List orders) { final Map<DateTime, double> salesMap = {};
for (var order in orders) {
final orderDate = DateTime(order.orderDate!.year, order.orderDate!.month, order.orderDate!.day);
for (var item in order.orderItems) {
salesMap[orderDate] = (salesMap[orderDate] ?? 0) + item.price;
}
}
final sortedEntries = salesMap.entries
.map((entry) => DailySalesData(entry.key, entry.value))
.toList()
..sort((a, b) => a.date.compareTo(b.date));
return sortedEntries;
}
List
prepareMonthlyData(List orders) { final Map<DateTime, double> salesMap = {};
for (var order in orders) {
final orderDate = DateTime(order.orderDate!.year, order.orderDate!.month);
for (var item in order.orderItems) {
salesMap[orderDate] = (salesMap[orderDate] ?? 0) + item.price;
}
}
final sortedEntries = salesMap.entries
.map((entry) => DailySalesData(entry.key, entry.value))
.toList()
..sort((a, b) => a.date.compareTo(b.date));
return sortedEntries;
}
List
prepareYearlyData(List orders) { final Map<DateTime, double> salesMap = {};
for (var order in orders) {
final orderDate = DateTime(order.orderDate!.year);
for (var item in order.orderItems) {
salesMap[orderDate] = (salesMap[orderDate] ?? 0) + item.price;
}
}
final sortedEntries = salesMap.entries
.map((entry) => DailySalesData(entry.key, entry.value))
.toList()
..sort((a, b) => a.date.compareTo(b.date));
return sortedEntries;
}
class ReadyOrders {
ReadyOrders({this.orderDate, required this.orderItems});
final DateTime? orderDate;
final List
orderItems; }
class OrderItem {
OrderItem({required this.price});
final double price;
}
Learn more about the video tutorial here Multi Vendor App